Environmental Factors Leading to Bias in Fuzzing
[essay] 2 min read
Abstract
Fuzzing performance is often affected by subtle, easily overlooked factors, such as differences in default settings among fuzzers and hardware execution environments. Recognizing and mitigating these factors is essential for producing reliable and comparable experimental results.
본문
Many factors affect fuzzing performance, but some are easily overlooked although they can significantly distort results. Two particularly impactful yet often ignored variables deserve attention.
First is the difference in default settings among fuzzers. AFL++ provides an option to apply a bespoke dictionary consisting of keyword suggestions derived from code analysis. However, among AFL++ and its derivative AFLRun, only AFLRun enables this feature by default. If the researcher does not set an environment variable to disable it, the dictionary will help generate seeds that satisfy conditions involving hardcoded text comparisons, leading to faster bug reproduction.
Second is the hardware execution environment that affects EPS (executions per second). EPS means the number of test cases completed each second, and a higher EPS allows faster seed generation and increases the likelihood of triggering bugs earlier. Such environmental factors include the number of parallel sessions running and the core locations they are distributed on. High number of parallel sessions leads to lower EPS, probably because of higher temperature or memory bus congestion. The stark increase of EPS from 90 to 130 in Figure 1 when 20 of 40 sessions complete is a good example. Moreover, on our server arranged in rows of 8 cores, sessions assigned to outer rows showed lower EPS, as clearly shown in Figure 2. To mitigate this unexplained bias, we now assign cores evenly between inner and outer rows for each experiment.
Distorted experimental results from unintended factors can lead to false conclusions, particularly in comparative fuzzing research. Hence researchers must understand fuzzer settings and hardware, and maintain it consistent.
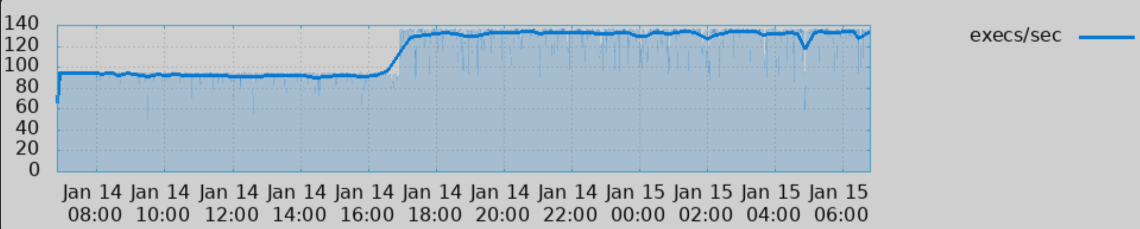
Figure 1: Change in EPS (executions per second) during experiment. A sharp increase is observed around 16:40, when 20 of the 40 sessions completed. This rise is reflected in the sky-blue filled area, which represents the EPS values over time.
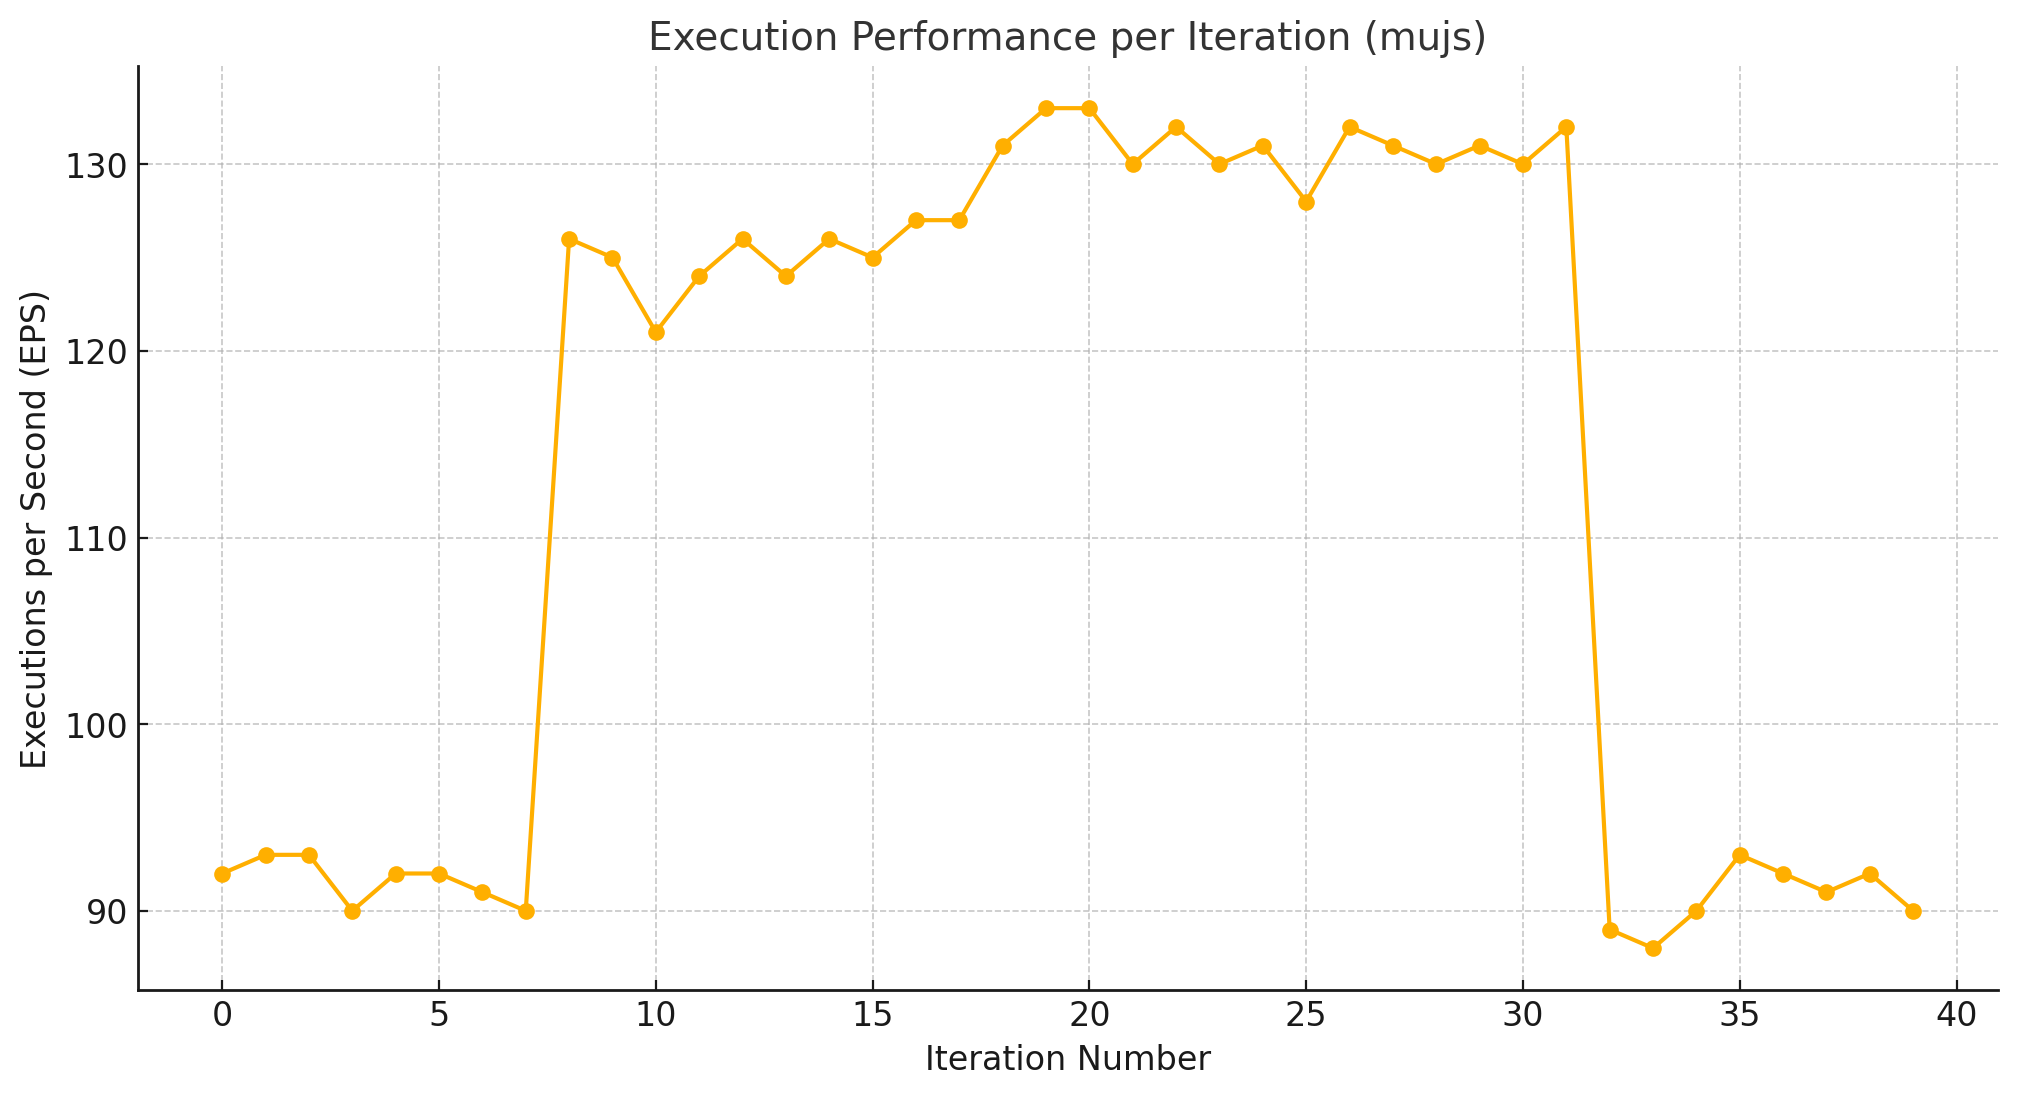
Figure 2: EPS during fuzzing of the mujs program, depending on core placement. Sessions with mid-range iteration numbers, corresponding to cores near the center, show higher EPS.